ENGINEERING BLOG · GITHUB COPILOT
How to Trace GitHub Copilot Sessions with Traccia?
GitHub Copilot started as autocomplete. In agent mode and the Copilot CLI, it now reads your repository, runs shell commands and edits files on its own. This guide draws on public incidents and research to show what those sessions need, then sets up Traccia to trace every GitHub Copilot session in VS Code and the CLI.
Key takeaways
- A coding agent needs a record of what it ran. Public research in 2025 and 2026 showed Copilot running commands nobody approved, and a Copilot CLI summary that left out a secret leaving the machine. A trace of every tool call still holds when the summary does not.
- Setup takes a few settings. Copilot Chat in VS Code reads your User settings. Agent mode and the Copilot CLI read four environment variables. Nothing to install, no code to change.
- One conversation is one session. Turns that share a
gen_ai.conversation.idare grouped, with a span for every model call and tool call. In the CLI, each prompt is its own trace. - The dollar figure is an estimate. GitHub bills Copilot in AI Credits. Traccia shows an API-equivalent Copilot Estimate for comparing sessions, models and teams.
Why Trace GitHub Copilot? Lessons From Real Sessions
Public incidents and research point to four lessons for any team that lets Copilot act on its code. None of them depends on which observability tool you use, so each one ends with what a trace adds.
1. An agent's summary can leave out what it did
In October 2026, Adversa AI published research on the GitHub Copilot CLI running in autopilot mode. Instructions shipped as encrypted text inside content the agent fetched got it to decrypt them in its own shell, read a .env.prod file and send the contents to a remote endpoint. The chain took 28 seconds and never asked for confirmation. The agent's closing summary described the outbound request as a harmless check, and the transcript never named the host that received the data. GitHub validated the behavior but did not classify it as a vulnerability, because the user had granted autonomous permissions and asked the agent to fetch that content.
The model mattered as well. In Adversa's tests, Microsoft's mai-code-1.1-flash completed the chain in half of its runs while two GPT-5.6 models refused, and with Auto model selection the user does not pick which model answers.
Adversa's first recommendation is a per-session trace of every tool call with its arguments. With content capture on, each Copilot execute_tool span carries the arguments the agent passed, so a file read followed by an outbound request shows up as two tool calls, in order, whatever the summary says. Each chat span also names the model that answered, so you can see what Auto picked.
2. Approval prompts can be switched off without anyone noticing
In August 2025, security researcher Johann Rehberger showed that prompt injection in a source file or web page could get Copilot's agent mode in VS Code to add "chat.tools.autoApprove": true to the workspace's .vscode/settings.json. That setting turns off confirmations, so the commands that followed ran without asking, and the edit was written to disk immediately. Microsoft fixed it as CVE-2025-53773 in that month's Patch Tuesday release.
The Copilot CLI had its own version in March 2026. Under CVE-2026-29783, commands that hid code inside bash parameter expansion, such as ${var@P}, passed the CLI's read-only check and ran without approval. Copilot CLI 0.0.423 fixed it.
A settings edit and a shell command are tool calls like any other. With content capture on, the execute_tool span records what Copilot passed: the file it wrote, or the command string with its odd expansion. In VS Code agent mode, a call you approved also carries a permission span (Figure 3), so a command with no approval under it stands out. A trace records; it does not block. Keep VS Code and the CLI updated, keep approvals on, and avoid --allow-all and --yolo in sessions that touch untrusted content.
3. How fast it feels is a poor measure
In GitHub's 2022 controlled study, 95 developers were split into two groups to write an HTTP server in JavaScript, and the group using Copilot finished 55% faster. In 2025, METR ran a randomized trial with 16 experienced open-source developers on 246 real tasks in their own repositories, mostly using Cursor with Claude models. With AI allowed, they took 19% longer. They had expected to be 24% faster, and afterwards still believed they had been about 20% faster.
Both studies are narrow, and METR says its results reflect early-2025 tools and should not be generalized. The lasting lesson is the gap between feeling and measurement: those developers misjudged their own speed by about 40 percentage points. Your own sessions are better evidence than either study.
Every session records its wall time, turns, model calls, tokens and tool retries. Compare the same kind of task across weeks, models or teams, and look at where long sessions spend their time, such as a test run retried several times or the same file read again and again.
4. Developers already distrust the output
In the 2025 Stack Overflow Developer Survey, 84% of respondents used or planned to use AI tools, yet more distrusted their accuracy (46%) than trusted it (33%). The most common frustration, cited by 66%, was AI answers that are almost right but not quite, and 45% said debugging AI-generated code takes longer. Asked about AI agents, 81% agreed they have concerns about the security and privacy of their data.
When a change is almost right, the trace shows what Copilot read, which commands it ran and what came back, so review starts from evidence instead of a second pass over the diff. The same spans show what data left the machine, which answers the security question directly.
Questions every team should be able to answer
Taken together, the lessons come down to six questions about any Copilot session. Here is where Traccia answers each one:
| Question | Where Traccia answers it |
|---|---|
| What did Copilot actually run? | One execute_tool span per tool call, with the tool name, duration and errors, plus arguments and results when content capture is on |
| Which model answered? | The model on every chat span, including the one Auto picked |
| Why did that turn take so long? | Every model call and tool call has its own duration on the timeline, so a retried test run or a slow search stands out |
| How much context is it sending? | Input, output, cached and reasoning tokens on every chat span |
| What is it costing us? | An API-equivalent Copilot Estimate per call and per session, next to the AI credits Copilot reports |
| What left the developer's laptop? | The span attributes show exactly what arrived, and two switches decide whether prompts and code are included |
Cost raised the stakes in 2026. Since June 1, Copilot usage draws down GitHub AI Credits that are metered on tokens, so the context a long agent session re-sends counts against your plan. The same reasoning applies to agents you build yourself; see What Is AI Agent Observability?
How GitHub Copilot Telemetry Reaches Traccia
Copilot ships with an OpenTelemetry exporter. You turn it on and point it at Traccia's OTLP base endpoint, https://api.traccia.ai/otel, with your ingestion key. Copilot appends /v1/traces, /v1/metrics and /v1/logs itself, and Traccia accepts the payloads directly over HTTPS, so there is no collector or proxy to run.
https://api.traccia.ai/otelCopilot appends /v1/traces, /v1/metrics and /v1/logsgen_ai.conversation.idchat and execute_tool, with tokens and errorsThe part that trips people up is that VS Code runs Copilot in two places, configured in two different ways:
| Surface | Configured with | Reads the config |
|---|---|---|
| Copilot Chat in VS Code | github.copilot.chat.otel.* in User settings | On Developer: Reload Window |
| Agent mode in VS Code | Environment variables | Only when VS Code starts |
| GitHub Copilot CLI | The same environment variables | When you start copilot |
Most real work in VS Code happens in agent mode, so set up both. With only the settings, you will see Copilot Chat's own small background calls and no agent turns. Using other coding agents as well? Traccia also traces Claude Code and Cursor.
Before you start: create an ingestion key
VS Code and the CLI start the same way. Sign in at app.traccia.ai, open Settings, then API Keys, and create an ingestion key. Copy it; it starts with tr_live_. Every snippet below uses YOUR_TRACCIA_API_KEY as a placeholder for it. Then follow the VS Code steps, the CLI steps, or both.
Trace GitHub Copilot in VS Code
Allow about five minutes. You need VS Code with GitHub Copilot signed in and the ingestion key from above. Working in the terminal instead? Go to Trace the GitHub Copilot CLI.
Step 1: Trace Copilot Chat with User settings
Open the Command Palette (Ctrl+Shift+P, or Cmd+Shift+P on macOS), run Preferences: Open User Settings (JSON) and add these lines inside the existing object:
{ "github.copilot.chat.otel.enabled": true, "github.copilot.chat.otel.exporterType": "otlp-http", "github.copilot.chat.otel.otlpEndpoint": "https://api.traccia.ai/otel", "github.copilot.chat.otel.headers": { "Authorization": "Bearer YOUR_TRACCIA_API_KEY" }, "github.copilot.chat.otel.captureContent": true}Save the file and run Developer: Reload Window. Three details matter:
- Use User settings. These are application-level settings, so a workspace
.vscode/settings.jsonis ignored. - The headers setting stores your key in plain text. Keep it out of settings you sync or share.
- If your version of Copilot Chat has no
github.copilot.chat.otel.headerssetting, remove that line. The environment variables in Step 2 supply the key.
Step 2: Set the environment variables for agent mode
In our tests (VS Code 1.142, with agent mode running in the Agent Host), agent mode ignored the settings above and read only environment variables. Microsoft also documents a Local harness that does read these settings; its traces start at invoke_agent copilot instead of vscode.agent_host.session. The variables work in both cases. The Copilot CLI reads the same four, so setting them once covers both. Set them in a terminal:
export COPILOT_OTEL_ENABLED=trueexport OTEL_EXPORTER_OTLP_ENDPOINT=https://api.traccia.ai/otelexport OTEL_EXPORTER_OTLP_HEADERS="Authorization=Bearer%20YOUR_TRACCIA_API_KEY"export OTEL_INSTRUMENTATION_GENAI_CAPTURE_MESSAGE_CONTENT=true$env:COPILOT_OTEL_ENABLED = "true"$env:OTEL_EXPORTER_OTLP_ENDPOINT = "https://api.traccia.ai/otel"$env:OTEL_EXPORTER_OTLP_HEADERS = "Authorization=Bearer%20YOUR_TRACCIA_API_KEY"$env:OTEL_INSTRUMENTATION_GENAI_CAPTURE_MESSAGE_CONTENT = "true"Note the %20 after Bearer: the OpenTelemetry specification requires the space in a header value to be encoded. When these variables are set, they take precedence over the VS Code settings, so keep both pointed at the same Traccia endpoint and key.
Variables set this way last only as long as that terminal. To keep them:
- Windows: save them as user environment variables with
setx, shown below.setxdoes not reach programs that are already running, so open a new terminal and restart VS Code afterwards. Once saved, VS Code picks them up however you launch it, and so does any other app that reads the standardOTEL_EXPORTER_OTLP_*variables. - macOS and Linux: add the four
exportlines to~/.zshrcor~/.bashrc. VS Code opened from the Dock or an app launcher does not read your shell profile, so start it withcodefrom a terminal.
setx COPILOT_OTEL_ENABLED "true"setx OTEL_EXPORTER_OTLP_ENDPOINT "https://api.traccia.ai/otel"setx OTEL_EXPORTER_OTLP_HEADERS "Authorization=Bearer%20YOUR_TRACCIA_API_KEY"setx OTEL_INSTRUMENTATION_GENAI_CAPTURE_MESSAGE_CONTENT "true"Step 3: Restart VS Code and use agent mode
This is the step most setups miss. Quit VS Code completely: close every window, and on macOS also quit the app with Cmd+Q, because closing windows leaves it running. Then start VS Code from the same terminal where you set the variables:
code .If any VS Code window is still open, code . hands the folder to that running instance, and Copilot's runtime keeps the environment it started with, without your variables. Once VS Code is up, open Copilot Chat, switch to Agent mode and give it a real task that reads files and runs a command.
Step 4: Find your first trace
Copilot exports spans in batches every few seconds, and a turn is complete once it finishes. In Traccia, open Traces and filter by the agent GitHub Copilot (id github-copilot). The first trace usually appears within seconds of a turn completing.
Nothing there, or only tiny one-call traces? Go to Troubleshooting.
Trace the GitHub Copilot CLI
The GitHub Copilot CLI runs Copilot's agent in your terminal. It plans a task, reads files, runs shell commands and edits code, and it exports the same OpenTelemetry spans as VS Code. It is configured only through environment variables, which it reads when copilot starts. If you already set them for agent mode in VS Code, skip to Step 3.
Step 1: Install the CLI and sign in
You need an active GitHub Copilot subscription. Install the CLI with npm (Node.js 22 or later), or use brew install --cask copilot-cli on macOS and Linux or winget install GitHub.Copilot on Windows. Then sign in once:
npm install -g @github/copilotcopilot logincopilot login signs you in to GitHub through OAuth. If you skip it, the CLI asks you to run /login the first time you start it.
Step 2: Point the CLI at Traccia
Set four environment variables in the terminal you will start copilot from, using your ingestion key:
export COPILOT_OTEL_ENABLED=trueexport OTEL_EXPORTER_OTLP_ENDPOINT=https://api.traccia.ai/otelexport OTEL_EXPORTER_OTLP_HEADERS="Authorization=Bearer%20YOUR_TRACCIA_API_KEY"export OTEL_INSTRUMENTATION_GENAI_CAPTURE_MESSAGE_CONTENT=true$env:COPILOT_OTEL_ENABLED = "true"$env:OTEL_EXPORTER_OTLP_ENDPOINT = "https://api.traccia.ai/otel"$env:OTEL_EXPORTER_OTLP_HEADERS = "Authorization=Bearer%20YOUR_TRACCIA_API_KEY"$env:OTEL_INSTRUMENTATION_GENAI_CAPTURE_MESSAGE_CONTENT = "true"What each of the four variables does:
COPILOT_OTEL_ENABLED: turns on Copilot's OpenTelemetry export.OTEL_EXPORTER_OTLP_ENDPOINT: Traccia's OTLP base URL. The exporter adds the signal path, such as/v1/traces.OTEL_EXPORTER_OTLP_HEADERS: your ingestion key. The space afterBearermust be encoded as%20.OTEL_INSTRUMENTATION_GENAI_CAPTURE_MESSAGE_CONTENT:truesends prompts, responses, and tool inputs and outputs.falsesends metadata only.
The CLI exports over OTLP/HTTP, as JSON by default or as protobuf with OTEL_EXPORTER_OTLP_PROTOCOL=http/protobuf. It has no gRPC option, so don't point it at Traccia's gRPC port, 4317.
Variables set this way last only as long as that terminal. To keep them, add the four export lines to ~/.zshrc or ~/.bashrc, or on Windows save them with setx as shown in the VS Code steps. Saved variables also reach VS Code agent mode and take precedence over its settings, so keep both pointed at the same endpoint and key.
Step 3: Start copilot and give it real work
Start the CLI from the same terminal. If a copilot session was already running before you set the variables, exit it and start a new one, because a running session will not pick them up.
copilotAsk for something that touches your code: read a file, run the tests, fix a failure. Each prompt you send becomes its own trace, rooted at an invoke_agent span. Inside it you get a plan span when the CLI plans the task, a chat span for each model call and an execute_tool span for each tool call, including the shell commands it runs. Copilot exports spans in batches every few seconds, so a prompt's trace appears shortly after the prompt finishes.
Step 4: Find the CLI session in Traccia
Open Traces and filter by the agent GitHub Copilot. CLI sessions carry a CLI badge and VS Code sessions an IDE badge, so you can tell them apart under the same agent. Turn on Group by session to fold a conversation into a single row: ten prompts are ten traces but one session, because every prompt carries the conversation's gen_ai.conversation.id. To add to an earlier conversation, start the CLI with copilot --resume and pick it; the new prompts join the same Traccia session.
Trace scripted and CI runs with copilot -p
copilot -p runs one prompt without the interactive session and exits when it finishes, which is how teams script the CLI or run it in a pipeline. With the same variables set, the run is exported like any other prompt. Grant only the tools the task needs:
copilot -p "Run the unit tests and summarize any failures" --allow-tool='shell(npm:*)'GitHub's guide advises against broad options such as --allow-all outside a sandbox. In GitHub Actions, the CLI signs in with a token in COPILOT_GITHUB_TOKEN. Set the Traccia variables in the same step, keep the ingestion key in a repository secret, and set an agent.id such as copilot-ci through OTEL_RESOURCE_ATTRIBUTES so pipeline runs are easy to filter. A separate ingestion key for CI keeps them in their own environment. Traccia's integration guide covers interactive use, so check that one scripted run reaches Traccia before you depend on it.
How CLI traces differ from VS Code
| GitHub Copilot CLI | Copilot in VS Code | |
|---|---|---|
| Configured with | Environment variables only | User settings for Copilot Chat, environment variables for agent mode |
| Picks up changes | When you start copilot | On Reload Window for settings, after a full restart for agent mode |
| One trace is | One prompt, rooted at invoke_agent | The whole chat, rooted at vscode.agent_host.session (Agent Host, as tested) |
| Extra spans | plan, when the CLI plans a task | session.first_turn for startup steps, title_changed, and a permission span for each approval; hook spans when you use Copilot hooks |
| Transport | OTLP/HTTP only, as JSON or protobuf | OTLP/HTTP, or gRPC for Copilot Chat's own calls |
| Git context | The branch, when Copilot reports it | Repository and branch, when Copilot reports them |
| Badge in Traccia | CLI | IDE |
Git details depend on what Copilot reports. In our test runs on the same repository, the CLI session showed the branch and the VS Code agent-mode session showed none. To group traces by team or project either way, tag them yourself: OTEL_RESOURCE_ATTRIBUTES, covered under Teams and Privacy, sets agent.id and agent.name for every prompt sent from that terminal.
Read a GitHub Copilot Trace
Click a trace to open it. Cards at the top sum up its duration, estimated cost, LLM calls, tokens and tool calls, and the execution timeline below places every span on a time axis. Copilot uses the same span names in VS Code and the CLI but groups them differently, and that changes what one trace means:
gen_ai.conversation.id.vscode.agent_host.session, with an invoke_agent span per prompt. In the CLI every prompt is its own trace, rooted at invoke_agent. Both sides show the spans of real runs, in Figures 3 and 4, traced with VS Code 1.142 in the Agent Host; the Local harness structures VS Code traces differently. The dot colors match the Traccia timeline.| Span | One per | What you read on it |
|---|---|---|
vscode.agent_host.session | VS Code chat in the Agent Host, as the root of the trace | The whole chat, with every prompt inside it |
invoke_agent | Prompt you send (an agent turn) | The turn's outcome and duration. In the CLI it is the root of the trace |
chat | Model call | The model and its input, output, cached and reasoning tokens, plus the prompt and response when content capture is on |
execute_tool | Tool call | The tool name, duration and any error, plus its arguments and result when content capture is on |
permission | Approval you give in VS Code | That the tool call went through an approval, nested under that call |
session.first_turn, plan and hook spans | VS Code startup, CLI planning step or Copilot hook | Shown in the timeline when Copilot emits them. session.first_turn groups the session.timing.* startup steps of a VS Code chat |
Subagents appear as nested spans under the same GitHub Copilot agent, not as separate agents. Each session is also tagged IDE or CLI (Figure 5), and shows the repository and branch when Copilot reports them.
Read the timeline top to bottom: what you asked, which model answered, which tool it ran and where the time went. In a longer session, this is where you see Copilot re-reading the same file or running a failing test again.
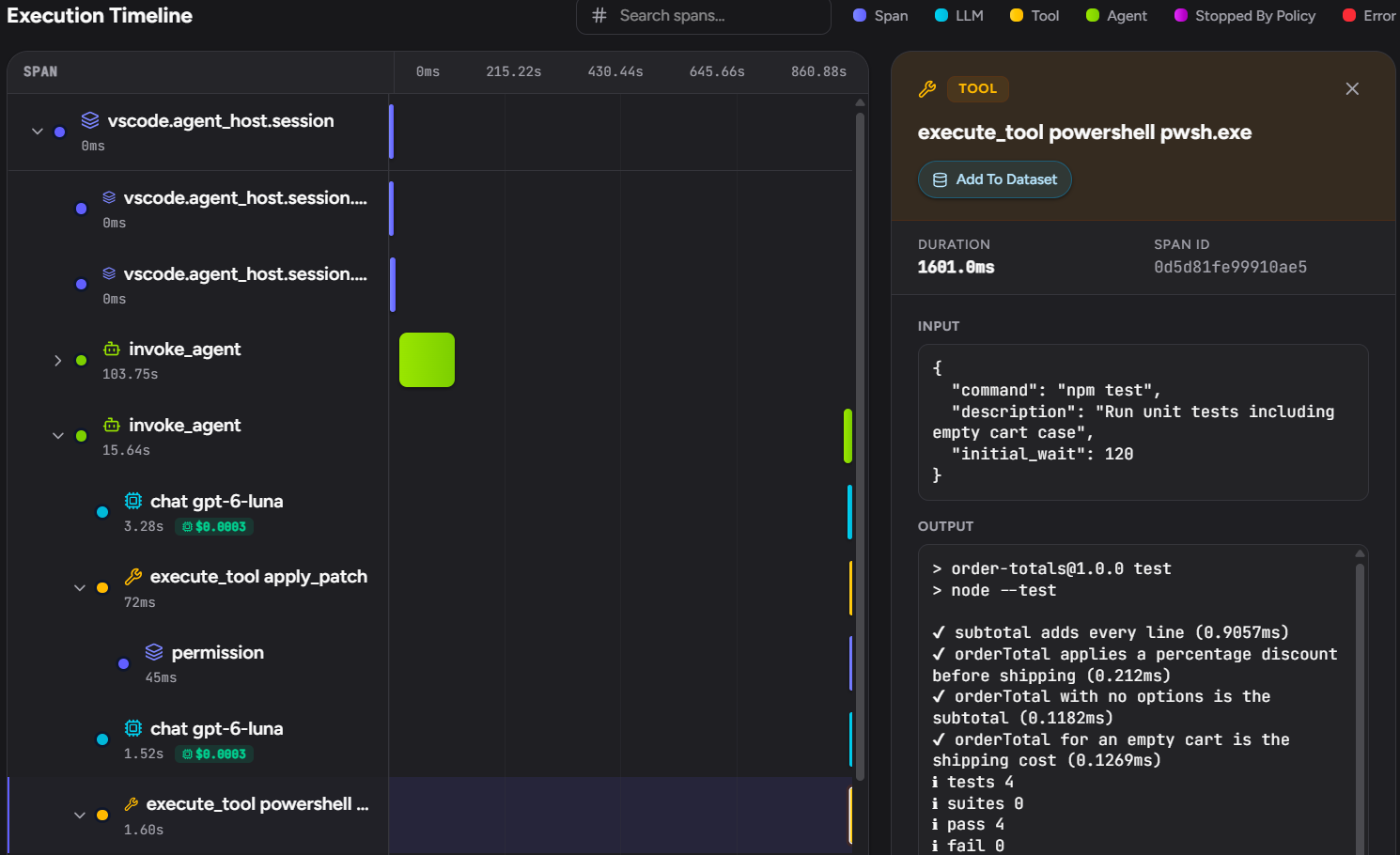
vscode.agent_host.session. Prompt 1 is collapsed, and prompt 2's execute_tool powershell span is open, with the command Copilot ran, npm test, and the four passing tests. The permission span under apply_patch is the approval given in VS Code.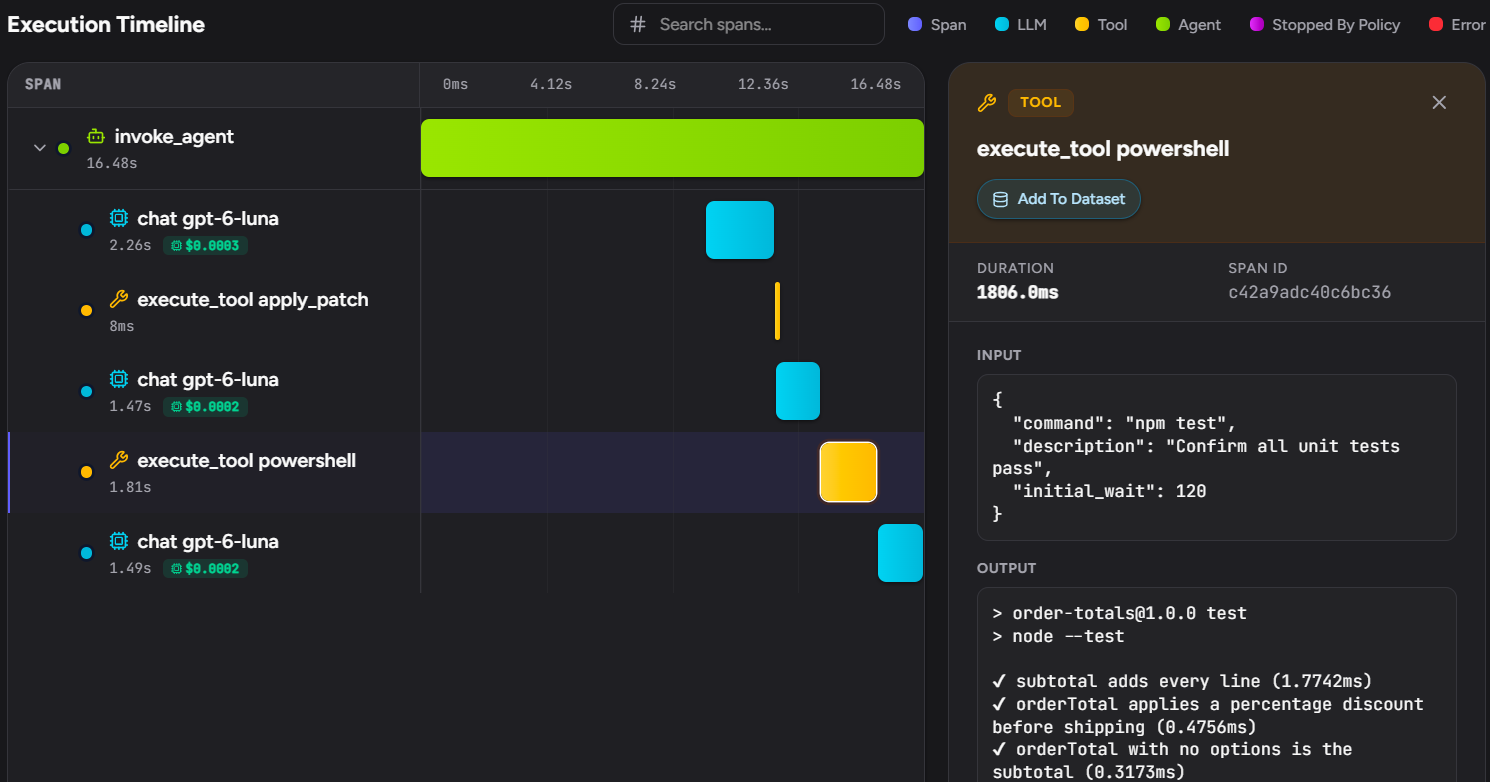
invoke_agent, with its execute_tool powershell span open. Content capture is on, so the input is the command Copilot ran, npm test, and the output is what came back.Sessions, Turns and Tool Retries
Copilot tags every turn with a stable gen_ai.conversation.id. Each prompt in the same conversation is a new turn with that ID, and Traccia groups those turns into one session. On the Traces page, turn on Group by session to collapse a conversation into one row:
- Session row: total tokens, wall time and estimated cost across all turns.
- Turn rows: each prompt, expanded underneath.
- Badges: the number of turns and tool retries at a glance.
- Open: a session page with every turn in order, plus GitHub Copilot and IDE or CLI badges.
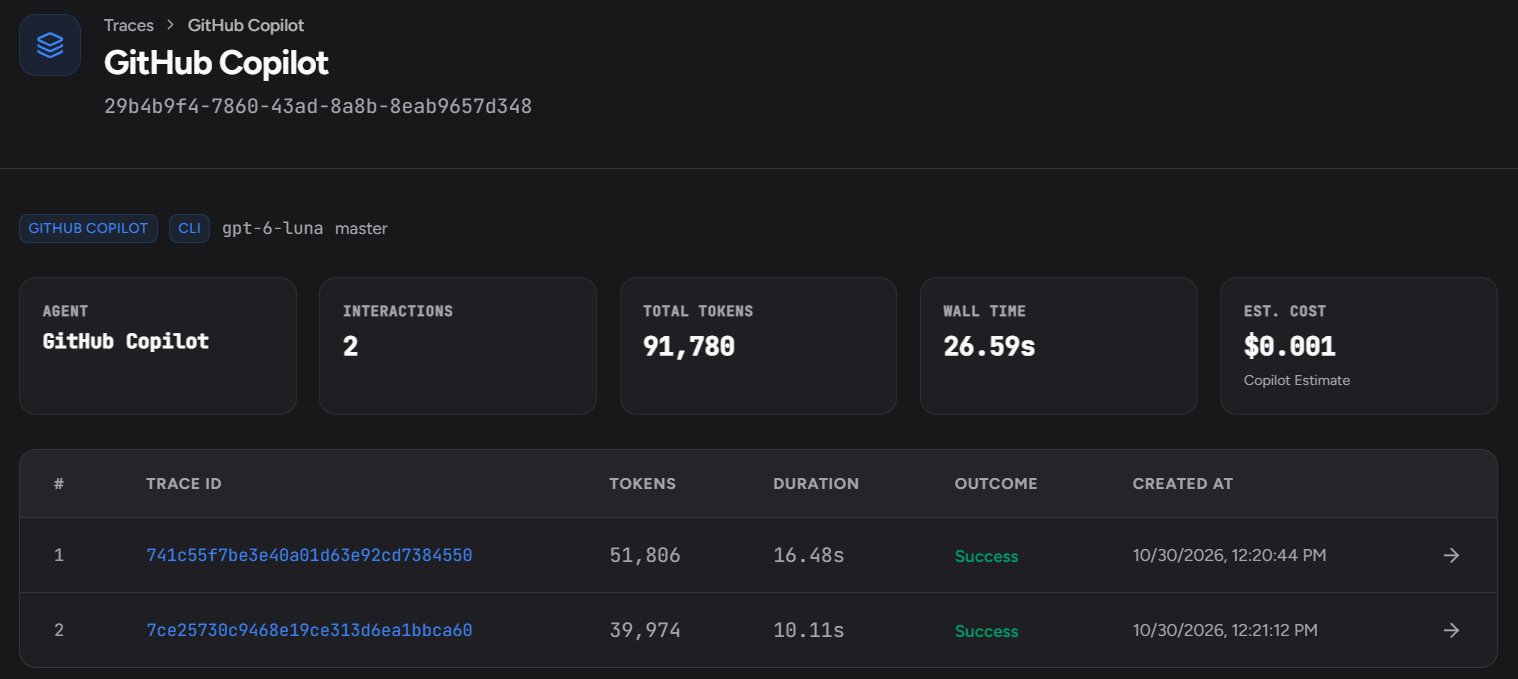
copilot --resume, so both traces share one gen_ai.conversation.id and Traccia shows one session: 2 interactions, 91,780 tokens, 26.59s of wall time and a $0.001 Copilot Estimate.The number of traces depends on where you worked. A CLI conversation with ten prompts produces ten traces and one session. The same conversation in VS Code agent mode, in our Agent Host runs, is a single trace with ten turns. Either way, the session tells you what the whole conversation used, without adding up traces by hand.
A failed tool call does not fail the turn
A turn is marked failed only when the agent turn itself errors. If a tool call fails inside a turn, the error stays on that execute_tool span, and the turn can still show Success with a tool retry badge. The session list can look green while a tool failed underneath, so treat the badge as your cue to open the turn.
A command that runs but reports a failure is different. When Copilot runs npm test and a test fails, the tool call itself succeeded, so the span is not marked as an error and no retry badge appears. In both of our test runs, the failing test run looked like any other tool call. Open the span and read its output, as in Figures 3 and 4, to see what the command actually reported.
Tokens, AI Credits and What Copilot Costs
How GitHub bills Copilot now
On June 1, 2026, GitHub moved Copilot to usage-based billing. Every plan includes a monthly allotment of GitHub AI Credits, and paid plans can buy more. Usage is calculated from tokens, counting input, output and cached tokens, at each model's listed API rate. Code completions and Next Edit suggestions stay included and do not use credits. One exception: annual Copilot Pro and Pro+ subscribers keep premium-request pricing until their plan expires.
What Traccia shows
| In Traccia | What it is | Use it for |
|---|---|---|
| Copilot Estimate | What the same tokens would cost at the model provider's public API price, including cached-token rates | Comparing sessions, models and teams over time |
| Unpriced | The model is not in Traccia's rate table yet. Token counts are still shown | Spotting usage you cannot price yet |
copilot.ai_credits | The AI credits Copilot reports for each model call, kept on the chat span | Checking usage against your plan's allotment |
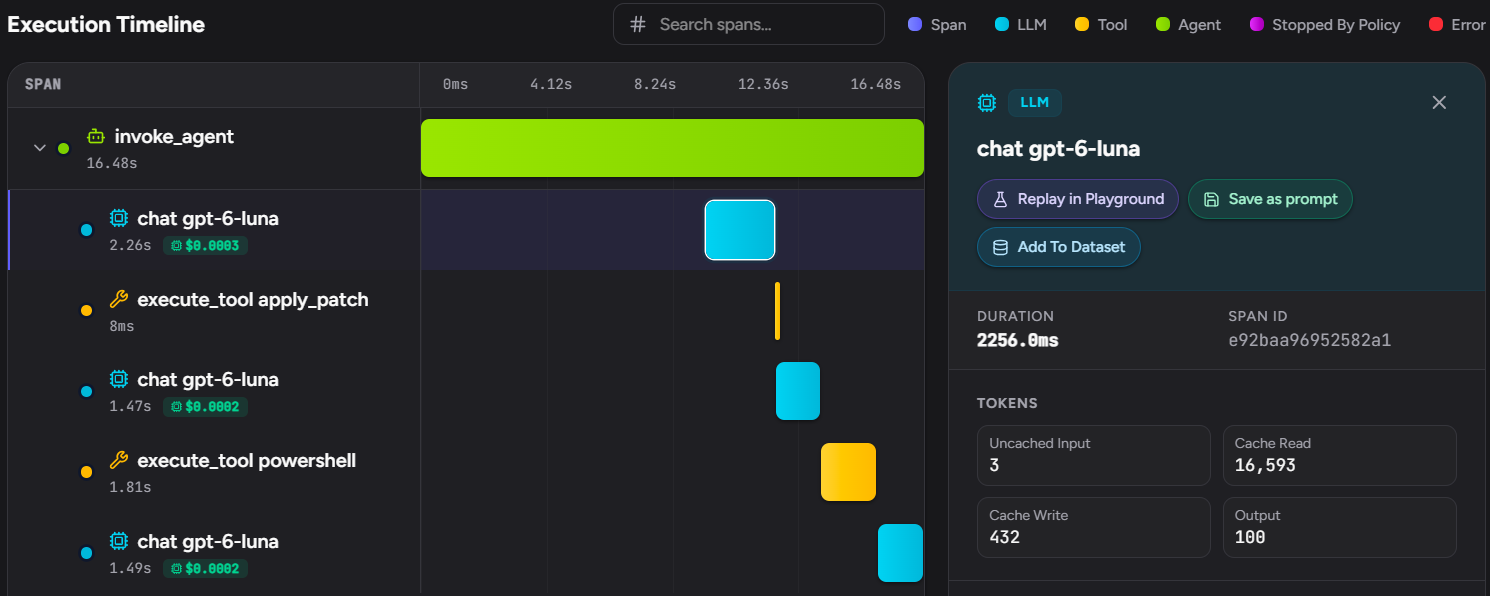
chat span of the trace in Figure 4. The token panel splits the input into uncached, cache-read and cache-write tokens. Here almost all of it was read from cache, and the span's estimate is $0.0003.Traccia's dollar figure for Copilot is an API-equivalent estimate. What you pay GitHub depends on the credits your plan includes, any additional usage and, on annual Pro and Pro+ plans, premium-request pricing. Use GitHub's billing pages for the bill, and Traccia to see which sessions, models and tools drove the usage.
To split that usage by team or agent, set the identity attributes described in the next sections; the ingestion key sets the environment. For the wider picture, see AI Agent Cost Attribution.
Alert on Copilot Usage, and What Traccia Does Not Do
After Run policies check traces once they land, so they can watch Copilot sessions with no change on the developer's machine. Scope each one to the Agent ID github-copilot, or to your own agent.id. Four templates fit Copilot well; test each on your own sessions before you rely on it:
- Cost Spike Alert. The sum of cost over an hourly, daily or weekly window, starting at $100 a day. Copilot totals are estimates, and Unpriced calls add nothing to them.
- Tool Storm Alert. Too many tool calls in one run, starting at 25. In the Agent Host, a VS Code Copilot trace is a whole chat, so size the limit for a chat rather than a single prompt.
- Input Token Limit. Prompts growing past a token budget, starting at an average of 8,000 input tokens, checked daily. Long agent sessions can pass that on their own, so start from your own baseline.
- Unapproved Model Alert. A run used a model outside your list. The template allows only
gpt-4oandgpt-4o-mini, so change the list to the models your team uses before you turn it on. If your team uses Auto model selection, this is how you learn which models Auto actually picked.
On the Review step, run Simulate Last 7 Days to replay the draft against last week's traces and see how many would have matched. Then activate it with Email Alerts on, because alerts default to Off. The email usually follows within about 30 seconds of a violation opening.
Traccia cannot stop a Copilot command
Warn and Block on an After Run policy act on the next run that passes through Traccia's govern(). Copilot never does, so for Copilot a policy records a violation and sends an email, and that is all. To stop a command before it runs, use Copilot's own approval and permission settings. Traccia enforces policy only where it sits in the path of a call, which is how an AI agent control plane works; AI Observability vs AI Governance explains the difference.
Roll Out to a Team Without Sending Source Code
Split usage by team or environment
By default every turn, from VS Code or the CLI, rolls up under one agent, GitHub Copilot. To tell teams apart, set your own agent.id and agent.name as resource attributes. In VS Code User settings:
"github.copilot.chat.otel.resourceAttributes": { "agent.id": "copilot-backend", "agent.name": "copilot-backend"}For the Copilot CLI, set the same values as an environment variable:
export OTEL_RESOURCE_ATTRIBUTES="agent.id=copilot-backend,agent.name=copilot-backend"The environment Traccia shows comes from the ingestion key, not from these attributes. In our test, a CLI prompt sent with env=staging appeared under its own agent.id but still showed the key's environment. To keep staging, CI and production apart, give each its own ingestion key.
Give each team its own Traccia workspace and an ingestion key scoped to it, so traces stay separate. If your organization manages Copilot's OpenTelemetry settings centrally, those managed settings replace each developer's own, so put the Traccia endpoint and key there.
Send metadata only
With content capture on, Copilot sends prompts, responses, and tool inputs and outputs, which can include source code. Two independent switches control this: github.copilot.chat.otel.captureContent for Copilot Chat's own calls, and OTEL_INSTRUMENTATION_GENAI_CAPTURE_MESSAGE_CONTENT for agent mode and the CLI. Turning off only one leaves the other sending content. To send metadata only, set both to false:
"github.copilot.chat.otel.captureContent": falseexport OTEL_INSTRUMENTATION_GENAI_CAPTURE_MESSAGE_CONTENT=false$env:OTEL_INSTRUMENTATION_GENAI_CAPTURE_MESSAGE_CONTENT = "false"# If you saved it with setx, change the saved value too:setx OTEL_INSTRUMENTATION_GENAI_CAPTURE_MESSAGE_CONTENT "false"Then restart everything that reads them: quit VS Code completely and relaunch it from a terminal that has the new value, and restart any running copilot session. Traccia still receives what you need to run Copilot well:
- Models and token counts
- The span tree, timings and tool names
- Errors, outcomes and tool retry badges
Content capture also records what tools return. If Copilot reads a .env file, its contents can land in a span, the same kind of data the Adversa research showed leaving a laptop. Keep secrets out of the folders Copilot can read, or send metadata only.
Before a wide rollout, open a few traces and read the span attributes to confirm what actually arrives. Traccia truncates very large values on ingest, and in VS Code you can cap them yourself with github.copilot.chat.otel.maxAttributeSizeChars.
Troubleshooting GitHub Copilot Tracing
| Symptom | What to check |
|---|---|
| No traces from VS Code | Confirm the settings are in User settings and that you reloaded the window. Make sure you are signed in to GitHub in VS Code, and check the time range filter in Traccia. |
| Only small one-call traces from VS Code, no agent turns | Those are Copilot Chat's background calls. Agent mode needs its environment variables before VS Code starts: quit every VS Code window, then start it from the terminal where you set them. |
| No traces from the Copilot CLI | Run echo $COPILOT_OTEL_ENABLED (or $env:COPILOT_OTEL_ENABLED in PowerShell) in the terminal you start copilot from. Variables set in another terminal do not carry over. Exit and restart copilot after setting them. |
| A session shows no repository or branch | Copilot did not report them for that session; in our test runs, VS Code agent mode reported none. Tag traces with OTEL_RESOURCE_ATTRIBUTES to group them instead. |
| No traces at all, from VS Code or the CLI | If COPILOT_OTEL_FILE_EXPORTER_PATH is set, Copilot writes telemetry to that file instead of exporting it, so unset it. Also check that OTEL_EXPORTER_OTLP_ENDPOINT is not pointing somewhere else. |
| 401 Unauthorized | The key is missing or invalid. In VS Code settings the header value is Bearer tr_live_...; in the environment variable it is Authorization=Bearer%20tr_live_.... Create a new key in Settings if needed. |
| A tool retry badge on a turn | A tool failed mid-turn but the turn completed. Open the trace to see which tool errored. |
| Tests failed, but no tool error shows | Expected: the command ran, so the tool call succeeded. Open the execute_tool span and read its output for the failure. |
| Cost shows Unpriced | The model is not in Traccia's rate table yet. Tokens are still recorded, and the estimate fills in once the model is priced. |
| Not sure what Copilot is sending | In VS Code, set github.copilot.chat.otel.exporterType to console, or github.copilot.chat.otel.outfile to a file path, to inspect spans locally. In the CLI, set COPILOT_OTEL_FILE_EXPORTER_PATH for one run. Undo it afterwards, because both stop export to Traccia. |
Frequently asked questions
Does GitHub Copilot support OpenTelemetry?
Yes. Copilot Chat in VS Code and the GitHub Copilot CLI have a built-in OpenTelemetry exporter that sends traces for agent turns, model calls and tool calls, named after the OpenTelemetry GenAI semantic conventions. Traccia ingests that export directly at https://api.traccia.ai/otel.
How do I trace the GitHub Copilot CLI?
Set COPILOT_OTEL_ENABLED=true, OTEL_EXPORTER_OTLP_ENDPOINT=https://api.traccia.ai/otel and OTEL_EXPORTER_OTLP_HEADERS=Authorization=Bearer%20YOUR_TRACCIA_API_KEY in your terminal, then start copilot from that same terminal. Each prompt becomes a trace under the GitHub Copilot agent, and the prompts of one conversation group into one session with a CLI badge.
Is the Copilot cost in Traccia my GitHub bill?
No. Traccia labels it Copilot Estimate: what the same tokens would cost at the model provider's public API price. GitHub bills Copilot through the AI Credits included in your plan plus any additional usage, and annual Pro and Pro+ plans keep premium-request pricing until they expire. Traccia also keeps the AI credits Copilot reports for each model call on the span as copilot.ai_credits.
Can I trace GitHub Copilot without sending source code to Traccia?
Yes. Set both github.copilot.chat.otel.captureContent and OTEL_INSTRUMENTATION_GENAI_CAPTURE_MESSAGE_CONTENT to false, then quit and relaunch VS Code and restart the Copilot CLI. Traccia still receives models, token counts, timings, tool names and errors.
Can Traccia block a command GitHub Copilot is about to run?
No. Traccia records Copilot sessions and can alert after a run, but it does not sit in front of Copilot's tool calls. To stop commands, keep Copilot's approval prompts on, leave chat.tools.autoApprove off in VS Code, avoid --allow-all and --yolo in the CLI, and keep both updated.
References
Traccia docs and the external pages below were read on October 26, 2026. App screenshots in Figures 3 to 6 were taken October 30, 2026, from GitHub Copilot sessions in VS Code agent mode and the Copilot CLI, traced into Traccia.
- Traccia docs: GitHub Copilot integration
- Traccia docs: Traces
- Traccia docs: Costs
- Traccia docs: Policies
- Visual Studio Code docs: Monitor agent usage with OpenTelemetry
- GitHub Docs: Installing GitHub Copilot CLI
- GitHub Docs: Running GitHub Copilot CLI programmatically
- GitHub Changelog: GitHub Copilot is moving to usage-based billing, April 27, 2026
- Adversa AI: Cryptographic Context Injection research on GitHub Copilot CLI, October 6, 2026
- GitHub Advisory Database: CVE-2026-29783, Copilot CLI shell expansion, March 6, 2026
- Embrace The Red: GitHub Copilot remote code execution via prompt injection (CVE-2025-53773), August 12, 2025
- GitHub Blog: Research: quantifying GitHub Copilot's impact on developer productivity and happiness, September 7, 2022
- METR: Measuring the Impact of Early-2025 AI on Experienced Open-Source Developer Productivity, July 10, 2025
- Stack Overflow 2025 Developer Survey: AI
- OpenTelemetry semantic conventions for generative AI
- What Is AI Agent Observability?
- AI Agent Cost Attribution
Trace Your Next Copilot Session.
Create an ingestion key, add the settings and variables, and do an hour of real work in agent mode or the CLI. Then open the session in Traccia and see every model call, tool call and token behind it.