ENGINEERING BLOG · CLAUDE CODE
Claude Code Observability: Every Session, Tool Call, and Dollar
Claude Code already exports OpenTelemetry. Point it at Traccia with one settings block and see every session, model call, tool run, and the cost estimate Claude Code reports. No SDK, no wrapper, no collector.
Key takeaways
- A terminal agent needs a record of what it ran. In 2025, malware ran Claude Code with permission checks off to hunt for secrets, and two Claude Code CVEs let a command skip the approval prompt. A trace of every session and tool call is how you find out after the fact.
- Setup is one env block. Turn on telemetry, enable the trace, metric, and log exporters, and point them at Traccia in
~/.claude/settings.json. No code changes. - Content is opt-in. By default Claude Code redacts prompt text and Bash commands. Turn on
OTEL_LOG_USER_PROMPTSandOTEL_LOG_TOOL_DETAILSonly if you want them in the audit trail. - The dollar figure is an estimate. Traccia shows the
cost_usdClaude Code reports, which Anthropic documents as an estimated cost. Your invoice is still the source of truth.
Why Trace Claude Code? Lessons From Real Incidents
Claude Code is not autocomplete. It runs in your terminal, reads your repo, runs shell commands, edits files, spawns subagents, and keeps going until the task is done. One prompt can turn into dozens of model calls and tool runs. Three public incidents show why that activity deserves a record. Each one ends with what a trace adds.
1. Malware can drive the agent you installed
On August 26, 2025, malicious releases of the Nx build tool were published to npm. Wiz reported that the payload looked for installed AI coding CLIs, including Claude Code, and ran them with flags such as --dangerously-skip-permissions to search the machine for secrets and wallet files. The stolen data was pushed to public GitHub repositories named s1ngularity-repository.
Claude Code reads its telemetry settings from ~/.claude/settings.json, so a session started by a script under your account can export like any other. An unexpected session with no prompt from you, a burst of Bash and Read calls, and an odd start time is the kind of row you can spot on the Traces page.
2. Approval prompts have had bugs
In August 2025, Cymulate disclosed two Claude Code vulnerabilities. CVE-2025-54794 was a path restriction bypass, fixed in 0.2.111. CVE-2025-54795 let a crafted command run without the approval prompt, fixed in 1.0.20. Both needed untrusted content, such as a malicious file, to reach Claude Code's context.
Tool spans record which tool ran, when, and whether it failed. With OTEL_LOG_TOOL_DETAILS=1, they also carry the Bash command itself. Claude Code tags its telemetry with app.version, so you can also find sessions still running a version older than a fix.
3. Autonomous runs look different from human ones
In November 2025, Anthropic reported a state-sponsored group that used Claude Code as an autonomous orchestrator against about 30 targets, with the AI performing an estimated 80 to 90 percent of the tactical work. Anthropic caught it on its side. On your side, the same pattern shows up as volume: far more tool calls per session than a person at a keyboard produces.
Traccia counts tool calls per run, so a Tool Storm alert flags sessions that run far past your team's normal pace.
Questions every team should answer
| Question | Where Traccia answers it | Needs an opt-in? |
|---|---|---|
| Where did the time go? | Execution timeline with every model call and tool run | No |
| How big did the context get? | Peak context and cumulative tokens per session | No |
| What did this session cost? | Claude Code's reported cost estimate, rolled up per session | No |
| Which tools ran, and which failed? | Tool spans with status and tool retry badges | No |
| Which Bash commands ran? | Tool span attributes | OTEL_LOG_TOOL_DETAILS=1 |
| What was the developer's prompt? | user_prompt log events in the audit trail | OTEL_LOG_USER_PROMPTS=1 |
How Claude Code Telemetry Reaches Traccia
Claude Code sends OTLP traces, metrics, and logs to Traccia's ingestion endpoint. Traccia normalizes the claude_code.* spans, stitches prompts into sessions on session.id, and attaches the cost estimate from Claude Code's api_request log events. The result shows up on the Traces page like any other agent.
| Claude Code signal | What Traccia does with it |
|---|---|
| claude_code.interaction span | One trace per prompt, typed as the agent turn |
| claude_code.llm_request span | LLM span with model and token usage |
| claude_code.tool span | Tool span (Bash, Read, Edit, Grep, subagents) |
| session.id attribute | Groups interactions into one session |
| api_request log events | Claude Code's reported cost estimate (cost_usd) |
| claude_code.* metrics | Also stored as gen_ai.client.* for shared dashboards |
Setup in Four Steps
Step 1: Create an ingestion key
Sign in at app.traccia.ai, open Settings → API Keys, and create an ingestion key.
Step 2: Configure Claude Code
Add an env block to ~/.claude/settings.json. Over HTTP (protobuf):
{ "env": { "CLAUDE_CODE_ENABLE_TELEMETRY": "1", "CLAUDE_CODE_ENHANCED_TELEMETRY_BETA": "1", "OTEL_TRACES_EXPORTER": "otlp", "OTEL_METRICS_EXPORTER": "otlp", "OTEL_LOGS_EXPORTER": "otlp", "OTEL_EXPORTER_OTLP_PROTOCOL": "http/protobuf", "OTEL_EXPORTER_OTLP_TRACES_ENDPOINT": "https://api.traccia.ai/v2/traces", "OTEL_EXPORTER_OTLP_METRICS_ENDPOINT": "https://api.traccia.ai/v2/metrics", "OTEL_EXPORTER_OTLP_LOGS_ENDPOINT": "https://api.traccia.ai/v2/logs", "OTEL_EXPORTER_OTLP_HEADERS": "Authorization=Bearer YOUR_TRACCIA_API_KEY", "OTEL_SERVICE_NAME": "claude-code", "OTEL_RESOURCE_ATTRIBUTES": "agent.id=claude-code,agent.name=claude-code,env=production" }}Or over gRPC, with one endpoint for all three signals:
{ "env": { "CLAUDE_CODE_ENABLE_TELEMETRY": "1", "CLAUDE_CODE_ENHANCED_TELEMETRY_BETA": "1", "OTEL_TRACES_EXPORTER": "otlp", "OTEL_METRICS_EXPORTER": "otlp", "OTEL_LOGS_EXPORTER": "otlp", "OTEL_EXPORTER_OTLP_PROTOCOL": "grpc", "OTEL_EXPORTER_OTLP_ENDPOINT": "https://api.traccia.ai:4317", "OTEL_EXPORTER_OTLP_HEADERS": "Authorization=Bearer YOUR_TRACCIA_API_KEY", "OTEL_SERVICE_NAME": "claude-code", "OTEL_RESOURCE_ATTRIBUTES": "agent.id=claude-code,agent.name=claude-code,env=production" }}Every line matters. Leave out the exporter lines and Claude Code sends nothing, even with telemetry enabled:
| Variable | What it does |
|---|---|
CLAUDE_CODE_ENABLE_TELEMETRY | Turns on Claude Code's telemetry |
CLAUDE_CODE_ENHANCED_TELEMETRY_BETA | Turns on tracing. Without it you get metrics and logs but no spans |
OTEL_TRACES_EXPORTER | Set to otlp to send spans |
OTEL_METRICS_EXPORTER | Set to otlp to send token and cost counters |
OTEL_LOGS_EXPORTER | Set to otlp to send events, including the api_request events that carry cost |
OTEL_EXPORTER_OTLP_PROTOCOL | Claude Code has no default protocol, so set http/protobuf or grpc |
OTEL_EXPORTER_OTLP_HEADERS | Your Traccia ingestion key as a Bearer token |
OTEL_RESOURCE_ATTRIBUTES | The agent ID and environment Traccia files these traces under |
Restart Claude Code after editing settings
Step 3: Run Claude Code
claudeDo real work: read files, run tests, iterate. Telemetry exports every few seconds and flushes when you exit with /exit.
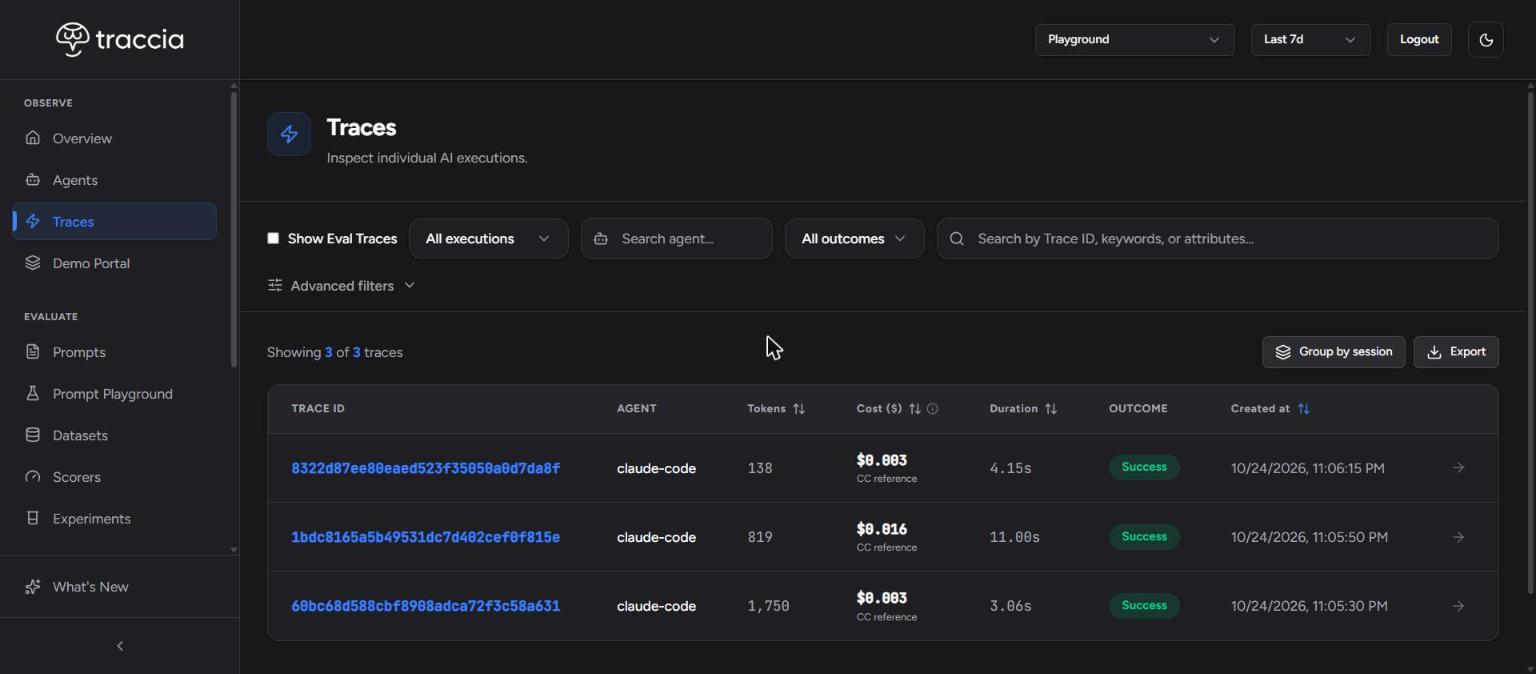
Step 4: Open Traces in Traccia
Each prompt is its own trace under the claude-code agent, with tokens, cost estimate, duration, and outcome.
What Gets Sent, and What Stays Redacted
The setup above sends metadata only. Claude Code redacts the text of your prompts and the details of tool calls unless you opt in. That default is safe for a first rollout, and it is enough for sessions, timelines, tokens, cost, and tool failure rates.
| Setting | Default | What it adds when set to 1 |
|---|---|---|
OTEL_LOG_USER_PROMPTS | Off | The text of each prompt on user_prompt events. Also turns on assistant response text unless OTEL_LOG_ASSISTANT_RESPONSES says otherwise |
OTEL_LOG_TOOL_DETAILS | Off | Tool parameters on tool events and span attributes: Bash commands, MCP server and tool names, skill names, and tool input |
OTEL_LOG_TOOL_CONTENT | Off | Tool output on the tool.output span event. Requires tracing |
OTEL_LOG_RAW_API_BODIES | Off | Full Anthropic API request and response bodies, including the entire conversation history |
To audit what the agent was asked and which commands it ran, add the first two to the same env block:
{ "env": { "OTEL_LOG_USER_PROMPTS": "1", "OTEL_LOG_TOOL_DETAILS": "1" }}Tool details and tool output include whatever Claude Code read or ran. If it opens a .env file or echoes a token, that value can land in a span. Keep secrets out of the folders Claude Code works in, and open a few traces to check what actually arrives before a wide rollout.
Sessions: One Conversation, One Row
Claude Code gives every conversation a stable session.id. Each new prompt is a new interaction that shares it. Turn on Group by session and the conversation collapses into one row with totals for tokens, duration, and cost. Expand it to see each prompt, or click Open for the session detail page.
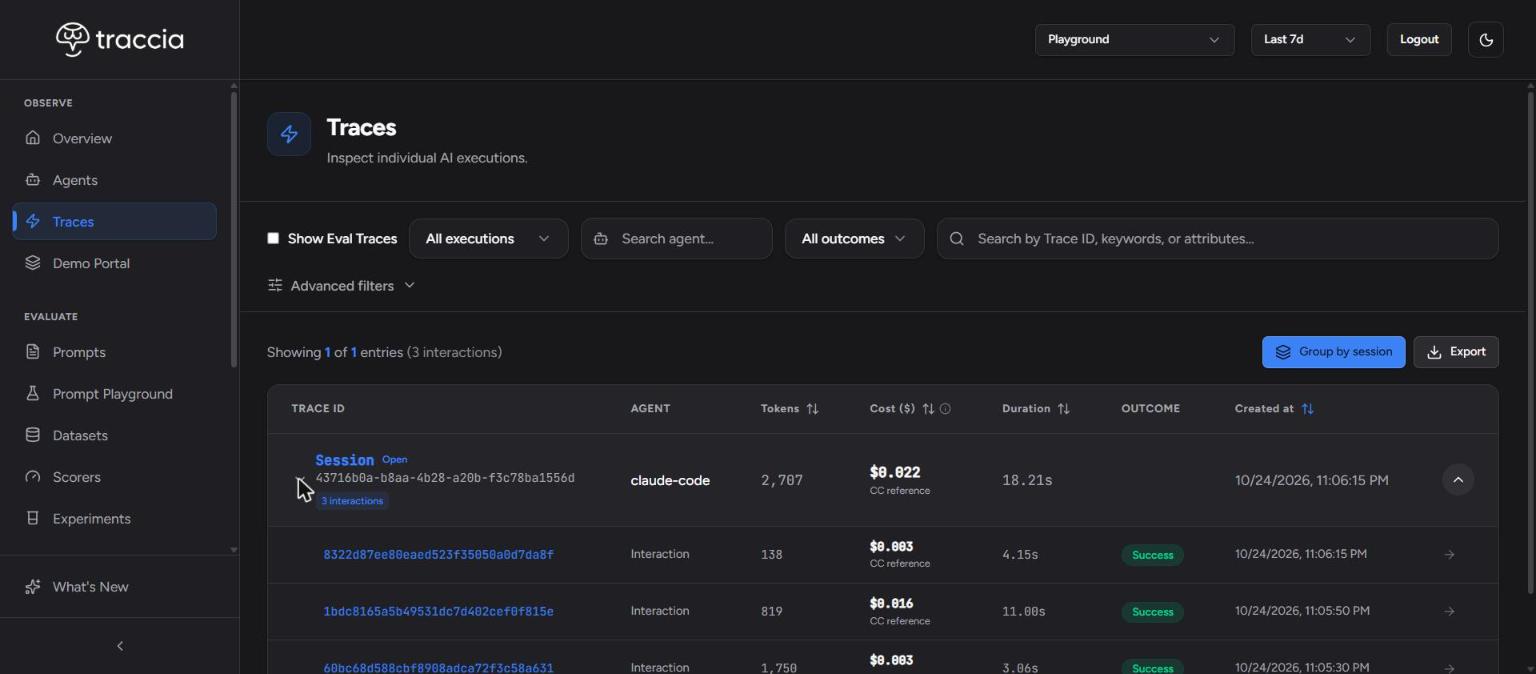
This answers "what did this coding session cost?" without adding up traces by hand.
Inside a Trace
Open an interaction to see the summary cards (duration, cost, LLM calls, total tokens, tool calls, status) and the Execution Timeline. The root claude_code.interaction span is the agent turn. claude_code.llm_request spans are model calls. claude_code.tool spans are Bash, Read, Edit, Grep, and subagent runs.
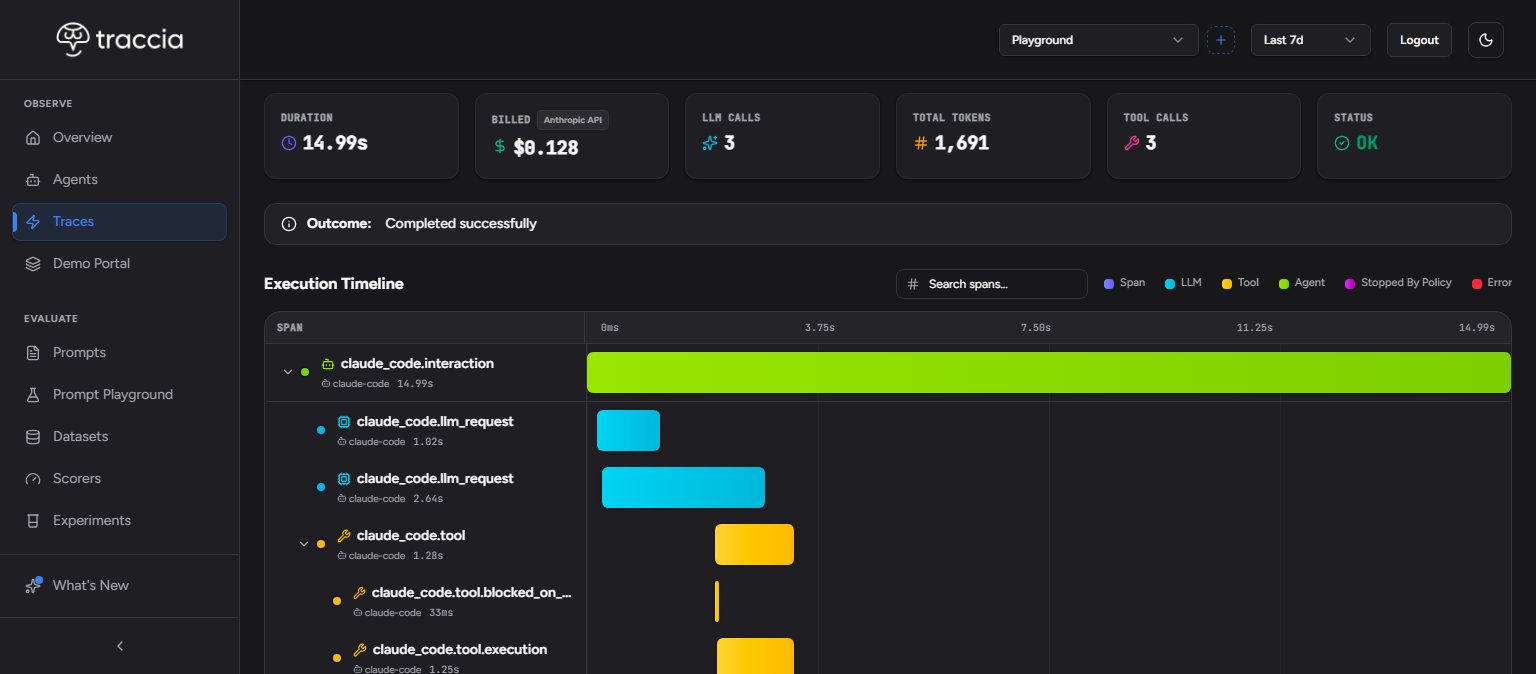
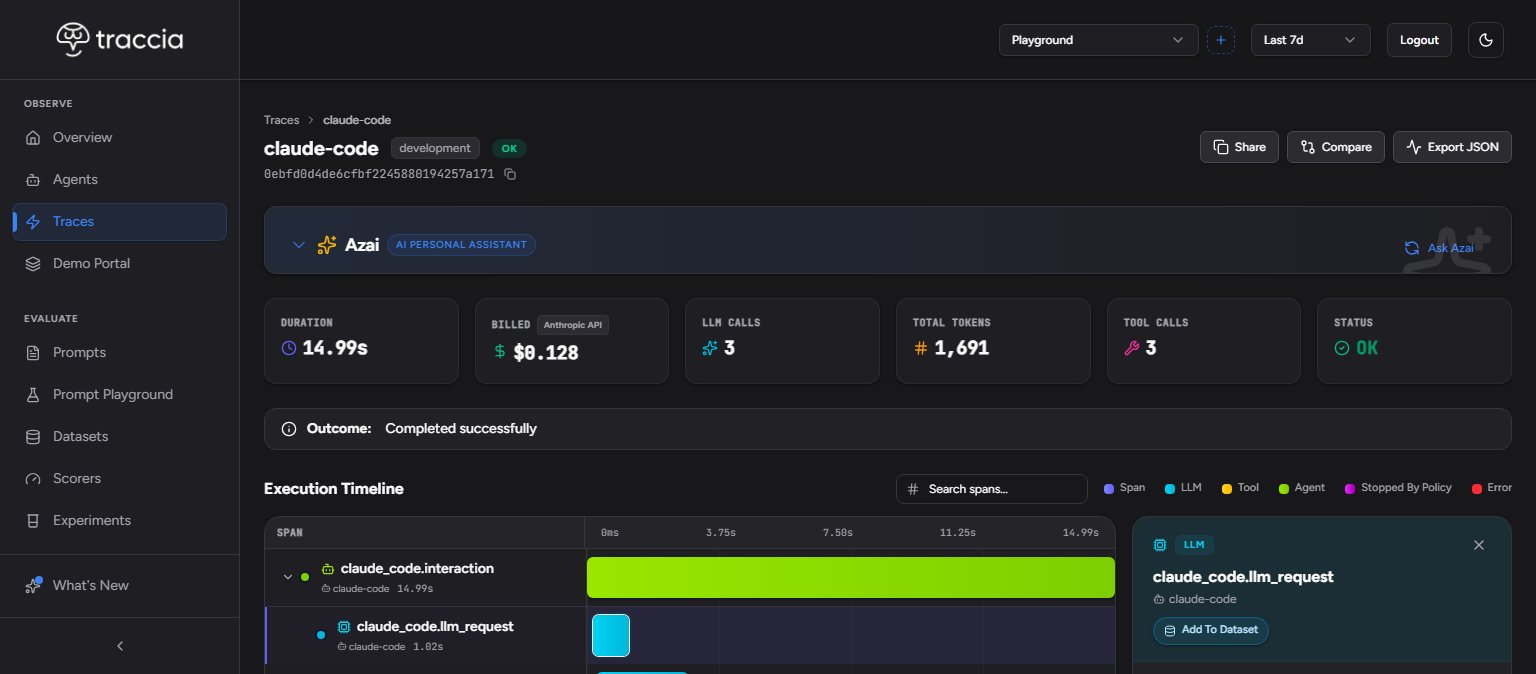
Click any span to open its drawer with model, tokens, cost, and attributes.
A failed tool call does not fail the turn
Say Claude Code runs your tests, pytest exits 1, and it edits the code and runs them again. Traccia keeps the error on the first tool span, adds a Tool retry badge to the interaction, and keeps the outcome as Success. You see how the agent recovered without a false alarm, and the badge is your cue to open the turn.
pytest run stays visible as an error span, while the turn itself is marked Success.Under the Hood
Before anything is stored, Traccia's ingestion service runs Claude Code spans through a dedicated normalizer. These excerpts come straight from that code.
Span typing
Each claude_code.* span gets a Traccia span type, and token counts are mapped to standard fields:
if name == "claude_code.llm_request":    attrs["span.type"] = "llm"    ...    input_tokens = _coerce_int(attrs.get("input_tokens") or attrs.get("gen_ai.usage.input_tokens"))    output_tokens = _coerce_int(attrs.get("output_tokens") or attrs.get("gen_ai.usage.output_tokens"))    if input_tokens:        attrs["llm.usage.prompt_tokens"] = input_tokens    if output_tokens:        attrs["llm.usage.completion_tokens"] = output_tokens
elif name.startswith("claude_code.tool"):    attrs["span.type"] = "tool"    tool_name = attrs.get("tool_name") or attrs.get("tool.name")    if tool_name:        attrs["tool.name"] = tool_name
elif name == "claude_code.interaction":    attrs["span.type"] = "agent"
Subagents stay inside the parent agent
A subagent's tool span carries its own agent_id. Left alone, every subagent run would appear as a new agent in your inventory. Traccia keeps it as metadata instead:
subagent_id = attrs.get("agent_id") or attrs.get("agent.id")if subagent_id: attrs["claude.subagent_id"] = str(subagent_id) attrs.pop("agent.id", None) attrs.pop("agent_id", None)parent_agent = attrs.get("parent_agent_id")if parent_agent: attrs["agent.parent_id"] = parent_agentHonest timelines
Claude Code can leave child spans open until the exporter flushes, which would make a five-second tool call look like a minute. Traccia caps child spans to the interaction window:
def _cap_claude_code_span_ends(payload): """Cap child span end times to the interaction window (CC leaves spans open until flush).""" ... if start and int(start) > cap_ns: span["startTimeUnixNano"] = cap_ns span["endTimeUnixNano"] = cap_ns elif end_ns and int(end_ns) > cap_ns: span["endTimeUnixNano"] = cap_nsStable agent identity
Model-suffixed IDs like claude-code-minimax collapse to claude-code, while deliberate team splits stay separate:
_TEAM_AGENT_SUFFIXES = frozenset({"backend", "frontend", "infra", "data", "mobile", "web"})
def normalize_agent_id(agent_id):    """Collapse legacy model-suffixed CC agent ids (e.g. claude-code-minimax) to claude-code."""    ...    suffix = agent_id[len("claude-code-"):]    if suffix in _TEAM_AGENT_SUFFIXES:        return agent_id    return "claude-code"
Metrics that fit existing dashboards
def alias_claude_code_metric_name(name: str) -> str: """Map CC metric names to gen_ai.client.* for dashboard compatibility.""" if name.startswith("claude_code."): suffix = name[len("claude_code."):] return f"gen_ai.client.{suffix}" return nameCost: Claude Code's Own Estimate
For runs against the Anthropic API, Traccia does not re-price tokens. It shows the cost_usd Claude Code reports on each api_request event. Anthropic documents that field as an estimated cost, so treat it as Claude Code's reported cost estimate, not your invoice.
Traccia also labels the figure by where Claude Code is routed:
def _ollama_billing_context(model, resource_attrs): if not model_str or _is_anthropic_model(model_str): return None if ":cloud" in model_str.lower(): return "ollama_cloud" env = str(resource_attrs.get("env") or resource_attrs.get("deployment.environment") or "") if env in ("local", "dev"): return "ollama_local" return None| Backend | Cost card in Traccia | What it means |
|---|---|---|
| Anthropic API | Claude Code's reported cost estimate, with an Anthropic API badge | Close to what the API charges, but your Anthropic invoice is the source of truth |
| Ollama Cloud | $0, plus a CC reference figure | Traccia does not price Ollama Cloud usage. $0 does not mean the usage was free |
| Local Ollama | $0, plus a CC reference figure when available | Inference runs on your hardware, so there is no API charge to show |
The cost card is labeled Billed, but for Anthropic runs the amount is Claude Code's estimate. For Ollama Cloud, $0 only means Traccia has no price for that usage: Ollama offers paid plans and usage beyond its free tier, so check your Ollama account for what you actually pay. The CC reference figure is the same tokens priced at Anthropic rates, for comparison only.
Peak context vs cumulative tokens. Traccia shows peak context (the largest single request, like /context in Claude Code) separately from cumulative usage (every API call added up). A long session can have high cumulative tokens and a modest peak. Both are correct.
Alert on Claude Code Usage, and What Traccia Does Not Do
After Run policies check traces once they land, so they can watch Claude Code with no change on the developer's machine. Scope each one to the agent ID claude-code, or to your team IDs. Four templates fit well; start from your own baseline before you rely on them:
- Cost Spike Alert. The sum of cost over a window, starting at $100 a day. It sums Claude Code's estimates, and $0 Ollama runs add nothing.
- Tool Storm Alert. Too many tool calls in one run, starting at 25. Long agentic tasks can pass that on their own, so size it for your team.
- Input Token Limit. Average input tokens past a budget, starting at 8,000. Claude Code sends large contexts by design, so raise this to fit.
- Unapproved Model Alert. A run used a model outside your list. The template allows only
gpt-4oandgpt-4o-mini, so replace the list with the Claude models your team uses.
On the Review step, run Simulate Last 7 Days to replay the draft against last week's traces and see how many would have matched, then turn on email alerts and activate it.
Traccia does not block Claude Code
--dangerously-skip-permissions, and keep Claude Code updated.Rolling Out to a Team
- Push the same env block to every developer with Claude Code managed settings, so nobody has to edit their own file.
- Give each team its own Traccia workspace and a workspace-scoped ingestion key so traces stay isolated.
- Decide on content capture once, in managed settings: metadata only, or with
OTEL_LOG_USER_PROMPTSandOTEL_LOG_TOOL_DETAILSfor a full audit trail. - Split profiles with distinct agent IDs:
OTEL_RESOURCE_ATTRIBUTES="agent.id=claude-code-backend,agent.name=claude-code-backend,env=production"Claude Code log events (tool decisions, API requests, and prompts when you opt in) also feed Traccia's audit pipeline. See the Compliance Hub. For the broader picture, read What Is AI Agent Observability?
Troubleshooting Claude Code Tracing
| Symptom | What to check |
|---|---|
| No data at all | Confirm the three exporter lines are set to otlp and OTEL_EXPORTER_OTLP_PROTOCOL is set. Restart Claude Code, run a prompt, and exit with /exit. |
| Metrics and cost, but no traces | Tracing is off by default. Set CLAUDE_CODE_ENHANCED_TELEMETRY_BETA=1 and OTEL_TRACES_EXPORTER=otlp. |
| Traces, but no cost | OTEL_LOGS_EXPORTER is missing. Cost comes from api_request log events. |
| 401 or no data with gRPC | Check the header is Authorization=Bearer YOUR_KEY and that port 4317 is open from your network. Try the HTTP settings instead. |
| Prompts and Bash commands show as redacted | That is the default. Set OTEL_LOG_USER_PROMPTS=1 and OTEL_LOG_TOOL_DETAILS=1 if you want them. |
| Traces appear, but not on the Traces page | Check the time range filter and that you are in the workspace your ingestion key belongs to. |
Frequently Asked Questions
Do I need an OpenTelemetry Collector to send Claude Code telemetry to Traccia?
No. Traccia accepts Claude Code's OTLP traces, metrics, and logs directly over HTTPS or gRPC. You add an env block to ~/.claude/settings.json that turns on telemetry, enables the trace, metric, and log exporters, and points them at Traccia.
Why don't I see traces after editing my settings?
Check that the env block sets CLAUDE_CODE_ENHANCED_TELEMETRY_BETA=1 and OTEL_TRACES_EXPORTER=otlp, since tracing is off by default. Then restart Claude Code, because it reads the env block when a session starts. Run a prompt, exit with /exit so telemetry flushes, and check the time range filter on the Traces page.
Is the Claude Code cost in Traccia my Anthropic invoice?
No. Traccia shows the cost_usd that Claude Code reports on each api_request event, which Anthropic documents as an estimated cost. Use it to compare sessions, developers, and models. Your invoice from Anthropic remains the source of truth for what you pay.
Does Claude Code send my prompts and commands to Traccia?
Not by default. Prompt text and tool details such as Bash commands are redacted unless you set OTEL_LOG_USER_PROMPTS=1 and OTEL_LOG_TOOL_DETAILS=1. Without them, Traccia still receives sessions, models, token counts, timings, tool names, and errors.
Can Traccia block a command Claude Code is about to run?
No. Traccia records Claude Code sessions after the fact and can alert on them, but it does not sit in front of Claude Code's tool calls. To stop commands, use Claude Code's permission rules and hooks, and avoid --dangerously-skip-permissions.
How do I separate Claude Code usage by team?
Give each team its own Traccia workspace and ingestion key, and use distinct agent IDs such as claude-code-backend and claude-code-frontend in OTEL_RESOURCE_ATTRIBUTES.
References
- Traccia Docs: Claude Code Integration (https://traccia.ai/docs/integrations/claude-code/)
- Traccia Docs: Platform OTLP Ingestion (https://traccia.ai/docs/platform/ingestion/)
- Traccia Docs: Traces (https://traccia.ai/docs/platform/traces/)
- Traccia Docs: Policies (https://traccia.ai/docs/platform/policies/)
- Traccia Docs: Compliance Hub (https://traccia.ai/docs/platform/governance/)
- Blog: What Is AI Agent Observability? (https://traccia.ai/blog/ai-agent-observability/)
- Anthropic: Claude Code monitoring and telemetry (https://code.claude.com/docs/en/monitoring-usage)
- Anthropic: Claude Code settings and managed settings (https://code.claude.com/docs/en/settings)
- Wiz: s1ngularity supply chain attack (August 2025) (https://www.wiz.io/blog/s1ngularity-supply-chain-attack)
- Cymulate: CVE-2025-54794 and CVE-2025-54795 in Claude Code (August 2025) (https://www.cymulate.com/blog/cve-2025-547954-54795-claude-inverseprompt/)
- Anthropic: Disrupting the first reported AI-orchestrated cyber espionage campaign (November 2025) (https://assets.anthropic.com/m/ec212e6566a0d47/original/Disrupting-the-first-reported-AI-orchestrated-cyber-espionage-campaign.pdf)
External sources read on October 26, 2026.
See your Claude Code sessions in Traccia
Create an ingestion key, add one env block, and your next session shows up in seconds.